Seasonal Forecasting: Exploration and Evaluation
Objectives
- To explore the current state-of-the-art in seasonal climate forecasting.
- To develop tools for assessing the accuracy and utility of
seasonal forecasts.
Task 1
(a) Peruse the NOAA Climate Prediction Center's web sites as well as
other sources, starting with these seasonal forecasting web sites.
(b) Search the Web for other possible sites with information. Please
try to come up with at least one more.
(c) After reviewing these products, answer these questions:
- Where would you like to spend Spring Break (based on expected
weather) and why? You should use at least 3 different sources of
information to support your reasoning.
- How much trust do you place in the forecasts you used for
question 1? Could you find information to support your degree of
trust in the forecast?
Email me your responses as well as the URL for additional site(s)
found by you.
Task 2
Start examining some quantitative forecast output
NCEP makes available experimental forecast output for up to six months
lead time for the fields surface air temperature, precipitation, and
200 hPa geopotential height. I have downloaded several forecasts. They
are stored on the Meteorology Program machines.
- Login to one of the Meteorology Program computers. If you are
not sure how to do this, follow directions in the guide, Accessing Meteorology Computers.
- Once on the machine, change directories to the MT455/555 work space:
cd /mthome/MT455.555
This puts you in a directory containing some fortran codes (files
ending in ".f"). Make your own subdirectory within this directory,
where you can do your work:
mkdir [yourname]
where [yourname] can be what ever you want, but I suggest you use your
login name on the system.
- Read the file "README_OUTPUT" to find out more about how NCEP
generated the forecast files. You can ignore for now the information
about the 1979-1999 "forecasts".
- There are 3 fortran files in the MT455.555/ directory that you
should examine:
- Extract_Tfore.f
- Extract_Pfore.f
- Extract_Zfore.f
As their names imply, they are nearly identical, so my discussion will
focus on Extract_Tfore.f. This is a code that can extract the temperature
forecasts for a particular point. If you specify a specific latitude
and longitude, the code finds the nearest gridpoint in the output data
set and extracts the information for that gridpoint. (If you are
feeling uncertain about reading and running fortran programs, please
let me know, though you should not have to edit and compile this one.)
- I'd like you to run Extract_fore.f. Simply type in its
executable form's name, preceeded by a "./":
./Extract_Tfore
It will start running and prompt you with a question:
Give personal identifier for output files
(three characters, surrounded by single quote marks (') )
This identifier will be a prefix to output files you generate running
this code, thus helping you identify your output while ensuring that
you do not overwrite someone else's output. For example, when I ran
the codes, I entered 'WJG'.
You next see
 Give target latitude (degrees)
 (Note:  90S = -90., 90N = +90., etc.)
You respond by simply typing in a target latitude of your choice (for
example, Ames, IA, is at approximately +42.) and pushing the return
key.
Then you will get another prompt:
 Give target longitude (degrees)
 (Note:  100W = -100., 190E = +100., etc.)
Enter the longitude (e.g., Ames, IA, is at about 93.5 W). Note the
importance of the minus sign here, esp. for longitudes west of
Greenwich! (e.g., 93.5 W = -93.5).
The code will give back some information regarding the closest NCEP
grid point to the target point you entered, then appear to sit silent
for a while, until you see a "Done!" statement. You've now completed
a run of the code.
- The code will produce two output files. When I ran them, these
files were written:
- WJG.T_Extract.out
- WJG.T_Extract.stat
The first file contains monthly average
surface air temperature forecasts, forecasting 1, 2, ... 6 months in
advance from early January 2003. Multiple forecasts (20) were created,
producing an ensemble of forecasts for each month. Thus,
WJG.T_Extract.out contains all 20 forecasts for the targeted point,
with one line for
each forecast month. The file WJG.T_Extract.stats contains summary
information: the average of the 20 forecasts and the standard
deviation of the 20 forecasts. The files are written in
comma-delimited format, so you can download them to a PC and read them
into a program that produces plots, like Excel. The "stats" file also
contains the units of the output.
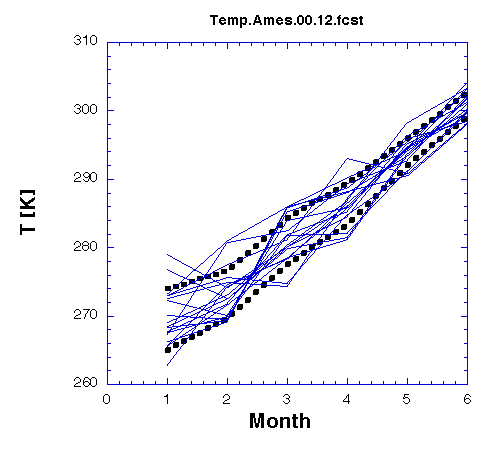
- Use the output files to create a plot like this one. The heavy dotted lines are
the average forecast +/- 1 standard deviation among all forecasts.
The lighter solid lines are the individual forecasts. "Month" on the
figure refers to how many months in advance is being forecasted.
- Assuming each forecast is equally valid, but contains some error,
the spread of forecasts is assumed to be proportional to overall
precision. When are the forecasts most precise? Least? Judging from
the figure (either mine or the one you create), about how precise is
the forecast of surface air temperature (that is, how many degrees?)
- Repeat this procedure with a couple of other points in very
different locations (e.g., over ocean, polar region, southern
hemisphere). How does precision change? How does the forecasted
climate change with month?
- Note that "precision" is not the same as "accuracy". The former
refers to the repeatability of the forecast, the latter how close the
forecast is to reality. What would you expect the accuracy of the
forecast to be relative to its precision?
Task 3
- (1) Discuss users of seasonal forecasts:
- - Who?
- - Why?
- - What is needed (including accuracy)?
- - Required lead time?
- - What value does forecast have?
- - Other relevant questions?
- - How would they use incomplete or marginally accurate forecasts to reduce risk?
- (2) Where will you find answers to these questions and others they prompt?
Some sources of information.
Report back to class in one week on focus issues brought up above that your group is researching, focusing on answering all questions above
Task 4
Turn in:
- Short summary of group's answers to the questions above
- Sources of information (books, web sites, people, etc.)
After each group addresses the questions above (preliminary assessment), then consider these questions:
- Can we start to form an index of accuracy/utility?
- How would one do this?
Some summaries of sector information.
Task 5
Develop (and defend) an index for the accuracy of a seasonal forecast as
it is relevant to your sector.
This index will use as input forecast errors and will give on output an error
measure that indicates forecast accuracy from the sector's perspective.
The index should be based on which forecast variables are most important to
the sector and should wieght them according to importance.
Several factors may affect the weighting, such as lead time, verification
time and location of the forecast.
This index will be the first step toward assessing the value of a forecast.
Obviously low error is the best, but error is inevitable. The real questions
are: How much error can the sector tolerate? How would a sector use an
imperfect forecast to "hedge its bets"? Addressing these issues starts to
give a sense of forecast value to the sector.
Some sector-dependent indices.
Task 6
Find additional web sites with seasonal information
- - How are they similar/different?
- - Who is their intended audience?
- - How do they get their information?
Special Challenge: We need forecast verification information
from at least
one source so that the sector-dependent indices
indices can be tested. Gather this information. Possible sources are:
- Further web pages
- Direct contact with forecasting centers (via email)
Task 7
Apply the preliminary utility index for your case.
Consider how changing the lead time affects the score for your index.
Testing will probably require using output from the hindcasts produced
along with the forecasts. Please follow these instructions to run the hindcast
output extraction codes.
Task 8
Write a report on your study. Among other things the report should
include:
- Introduction motivating the topic
- Description of data sources, their accuracy and their limitations.
- These would include the sector's behavior (e.g., number of forest
fires, outbtreaks of disease, etc.)
- Desciption of forecast output (fields, spatial resolution, period
covered, domain covered for your project, etc.)
- Analysis procedures and tools, e.g.,
- spatial averaging
- linear regression
- and any sort of data procesessing you performed
- Results
- Behavior of forecast versus comparable observations
- Behavior of forecasted sector index
- Intrepretation of results
- The issue for interpretation is not simply whether or not your chosen
index was good, bad or (most likely) something in between.
Interpretation should analyze why, when and where the index was good.
Suggestions for further improvement are desirable.
- The interpretation should also include some consideration of
whether or not the forecast at this time is good enough or not for
giving useful information to your sector. Note that "useful" does not
mean "perfect", but rather something that is an improvement over
random noise.
- The interpretation should thus be such that another person could
do research on the same topic in the future and build upon your experience.
In other words, your report should be structured like a published
scientific paper.
Some past reports for guidance.
Go to Mteor
455/555 home page