Go back to forecast sheet by clicking on the BACK button at the top of this window
|
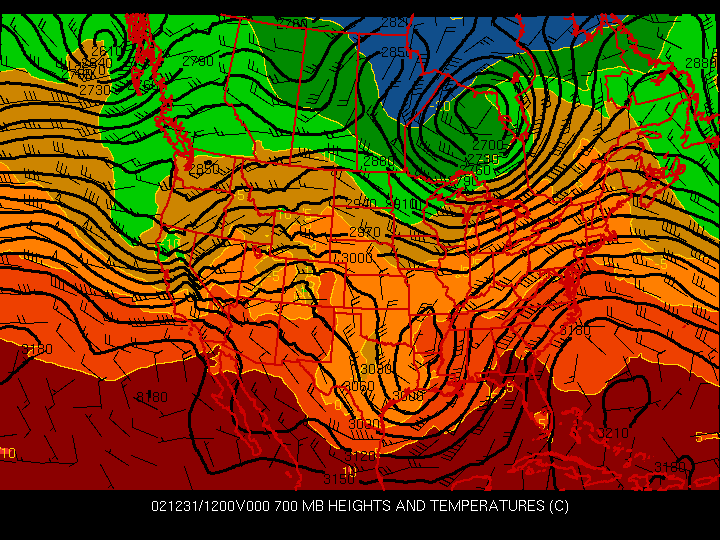
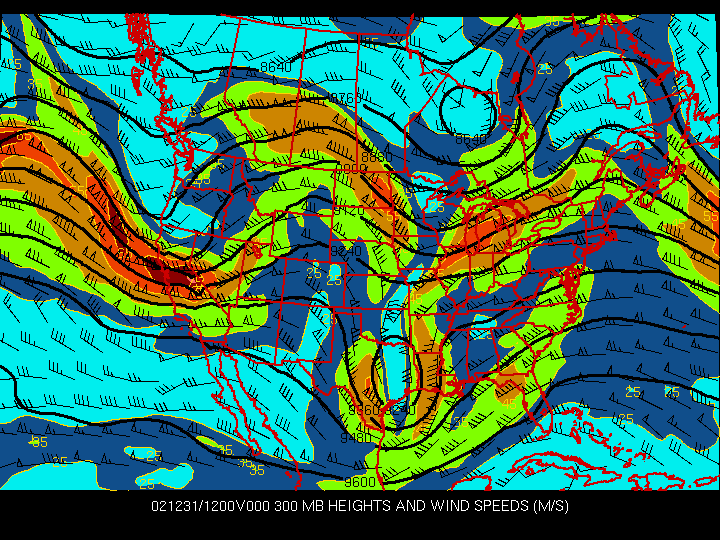
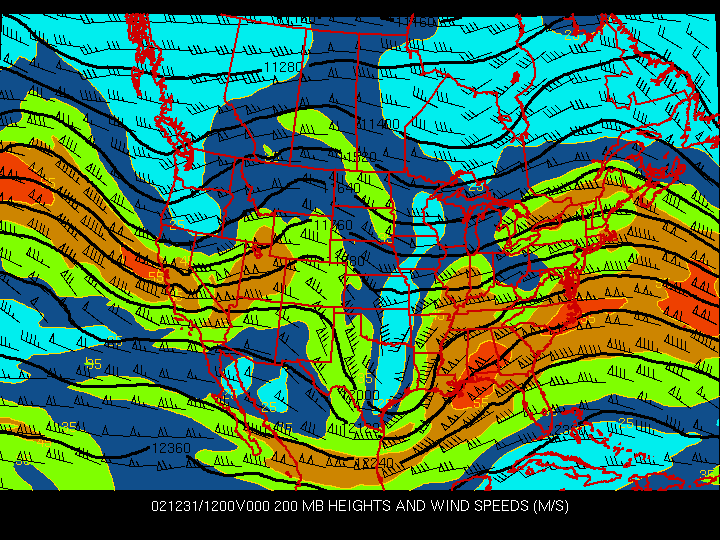
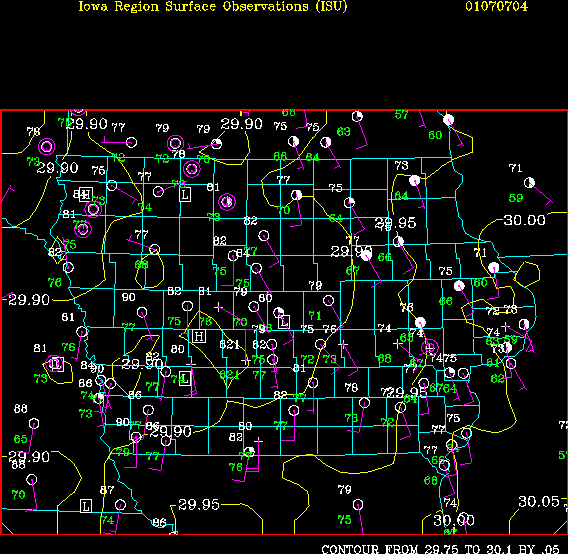
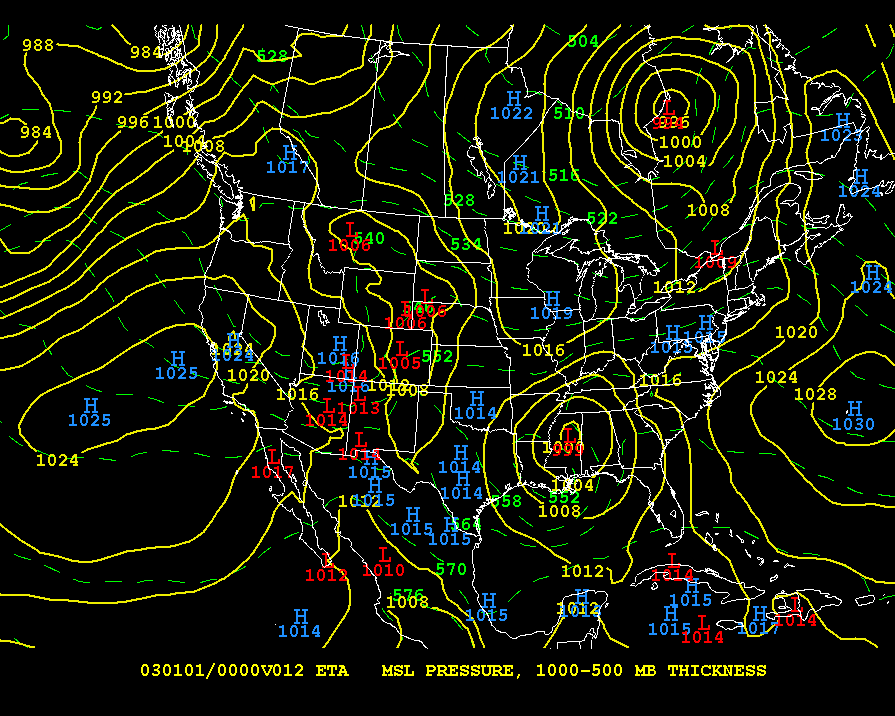
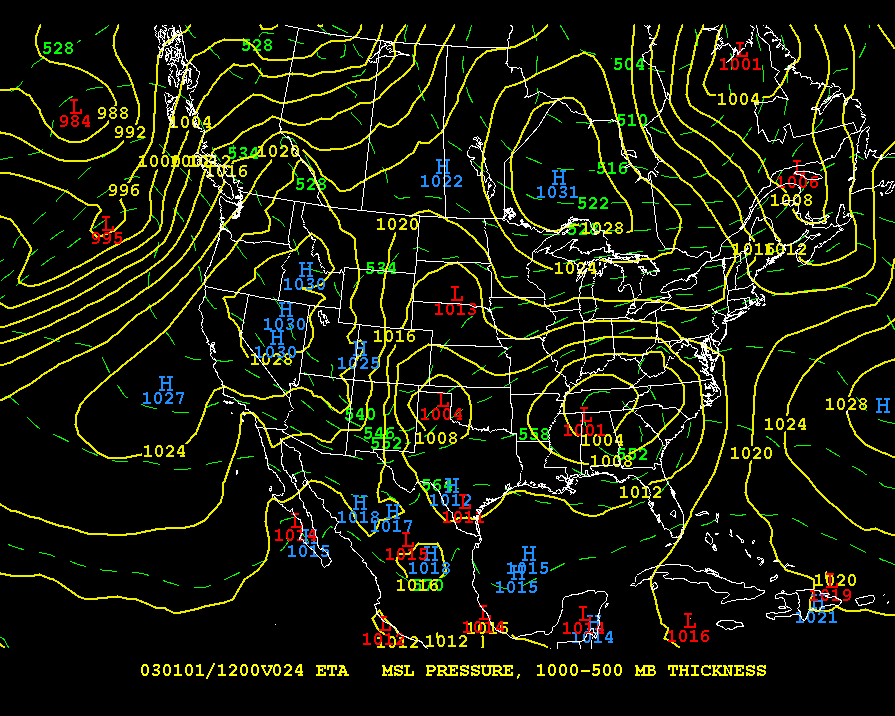
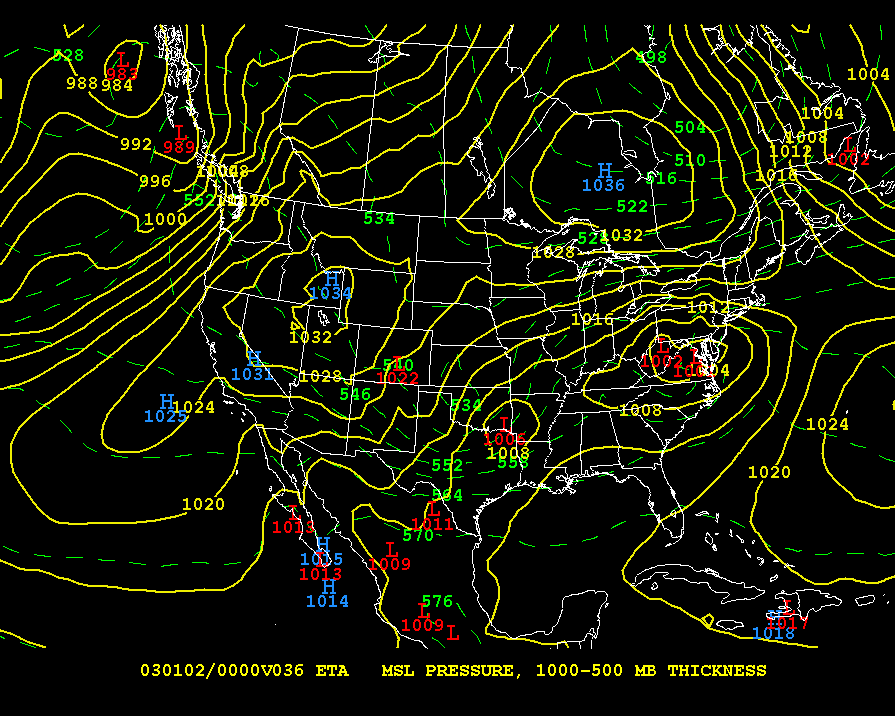
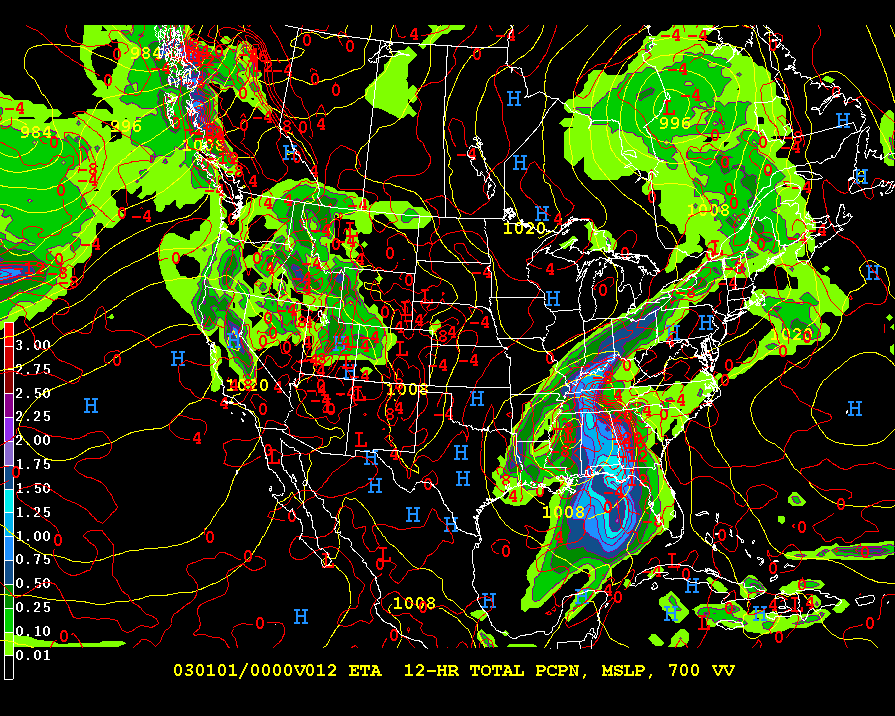
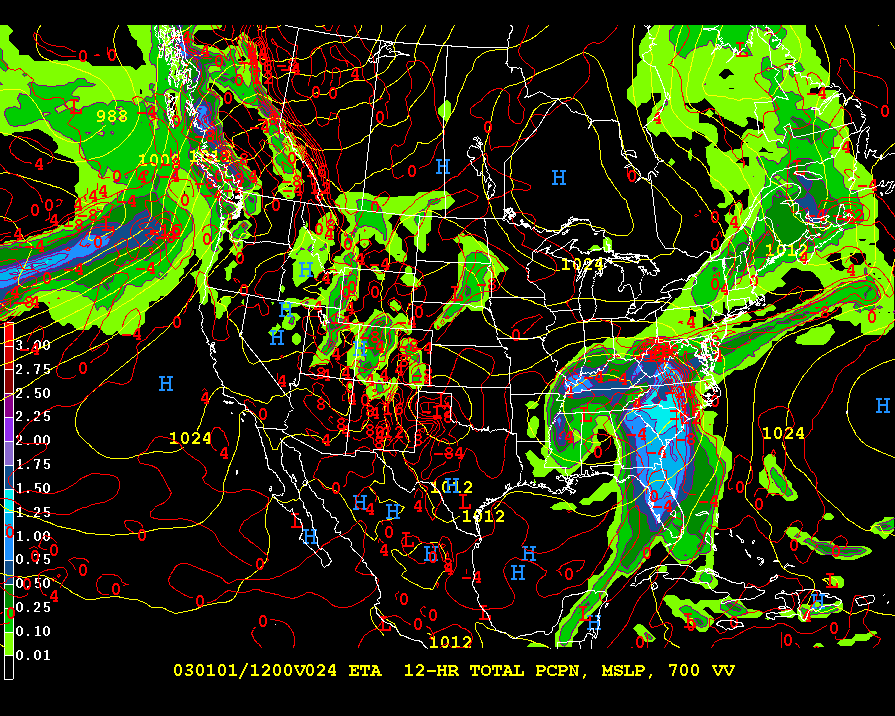
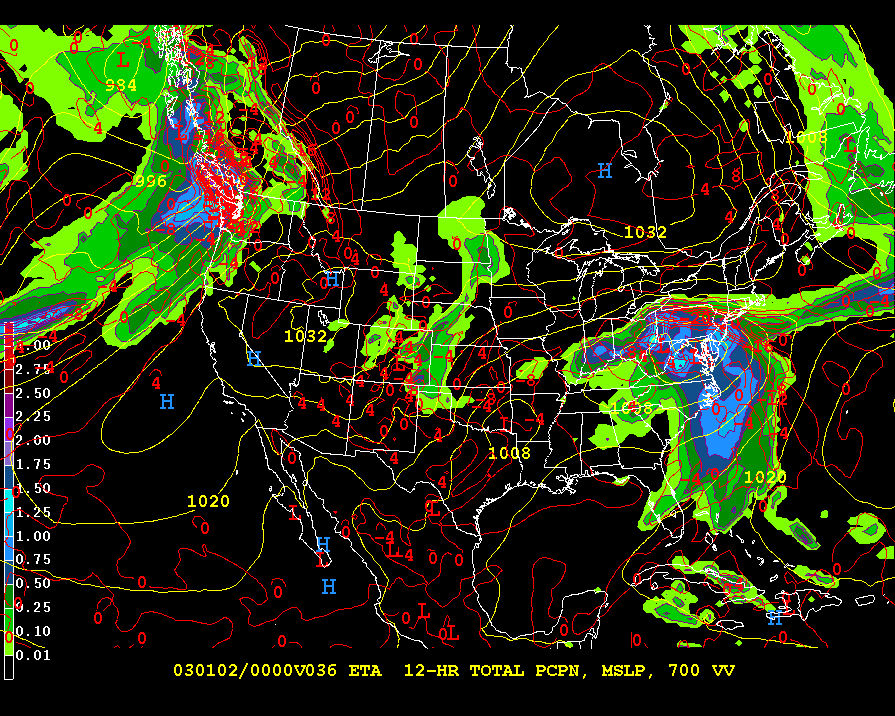
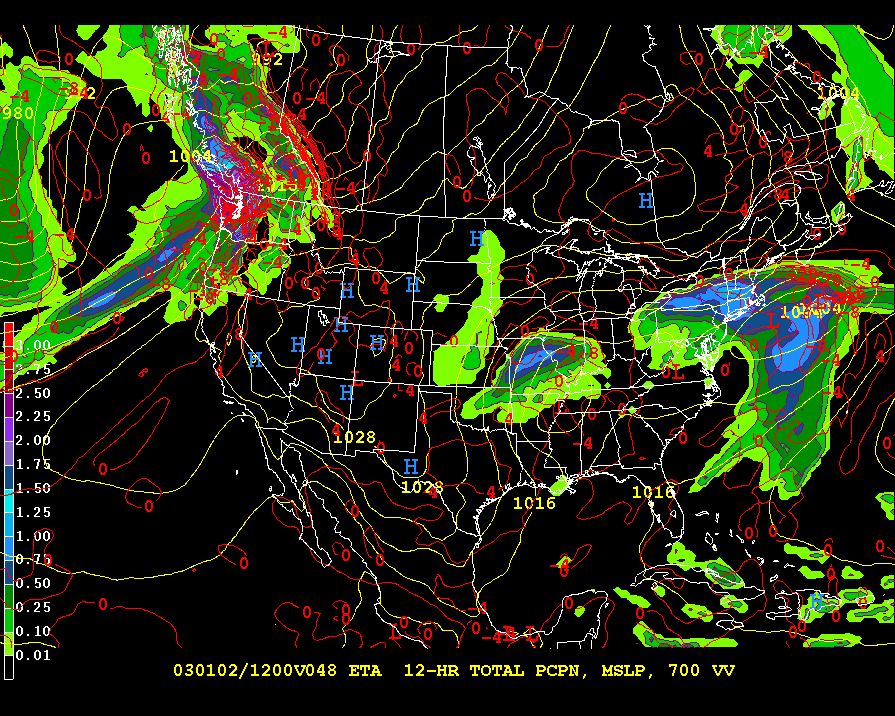
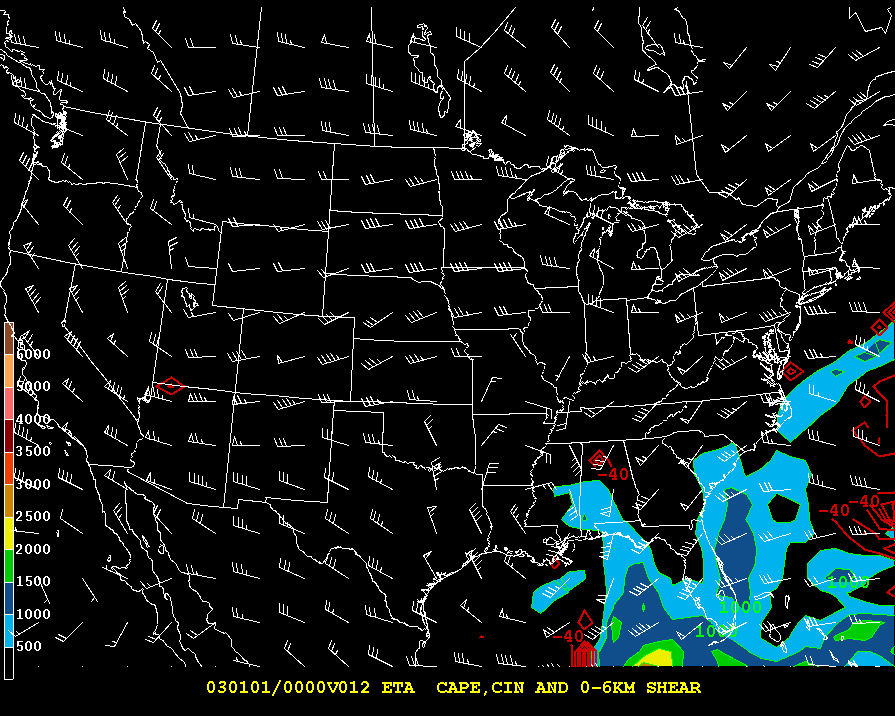
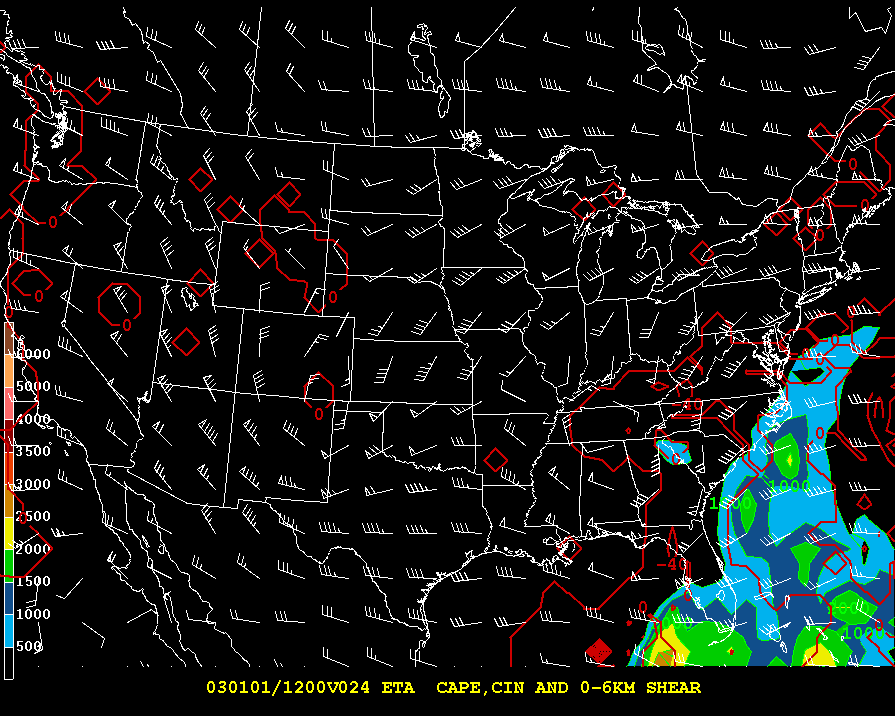
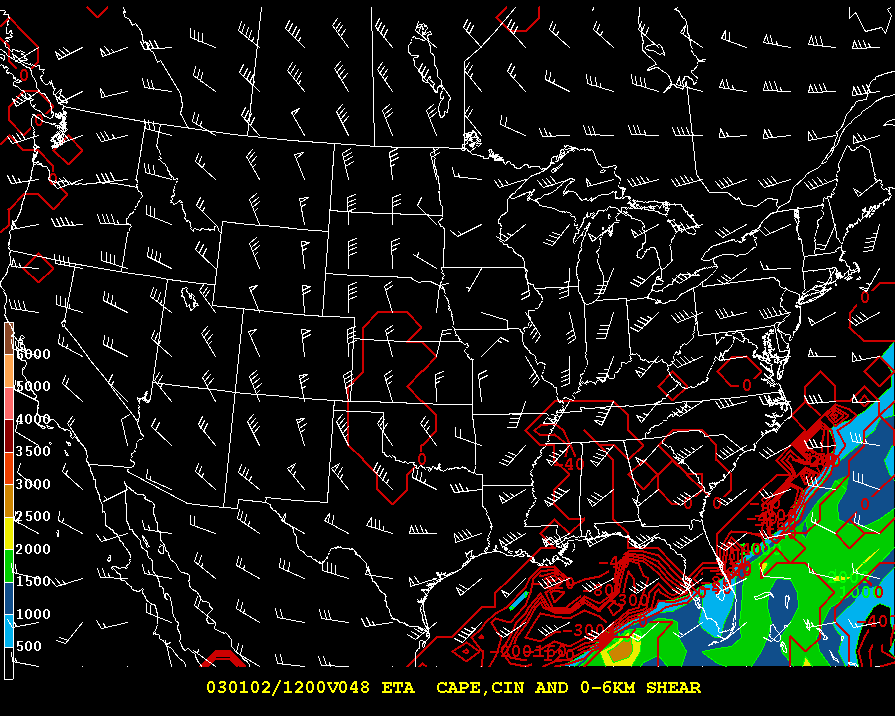
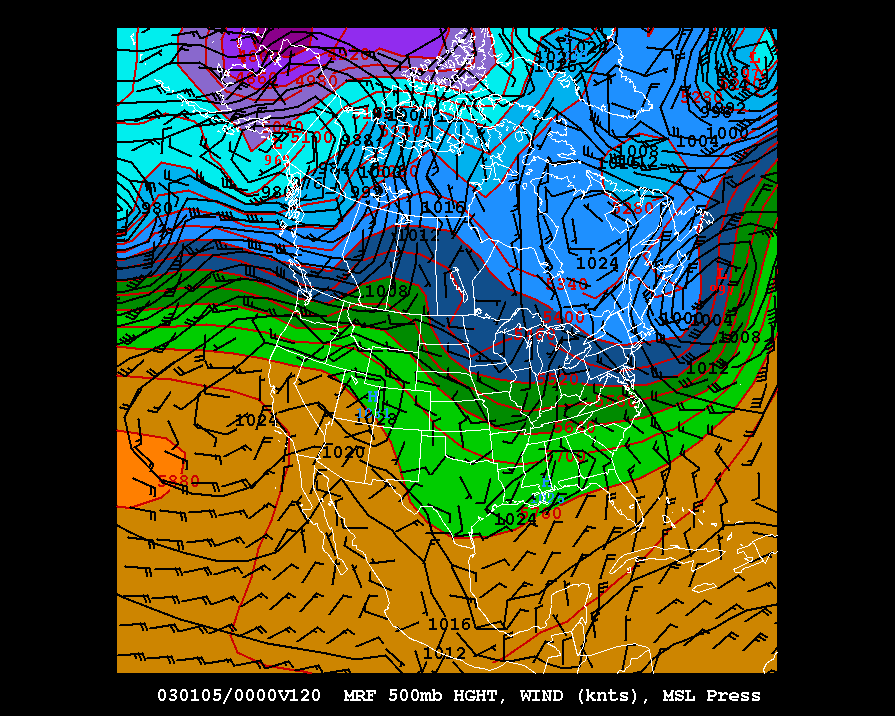
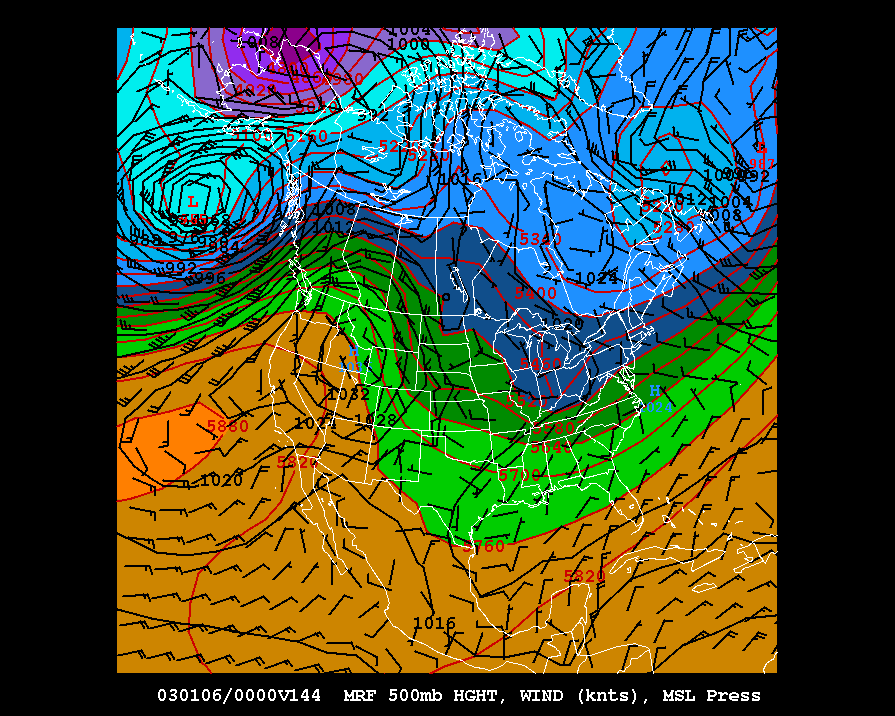
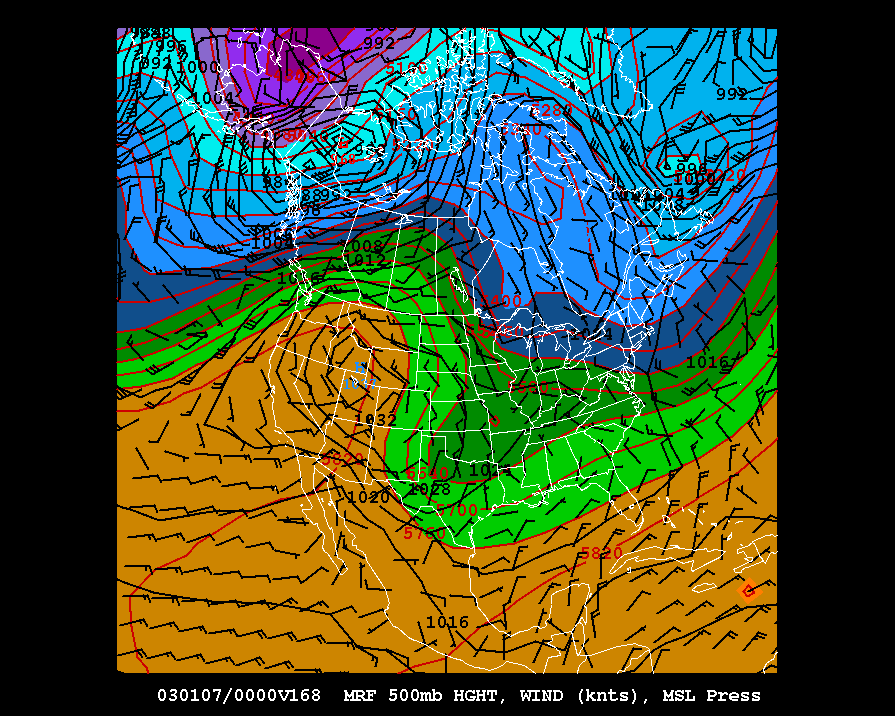
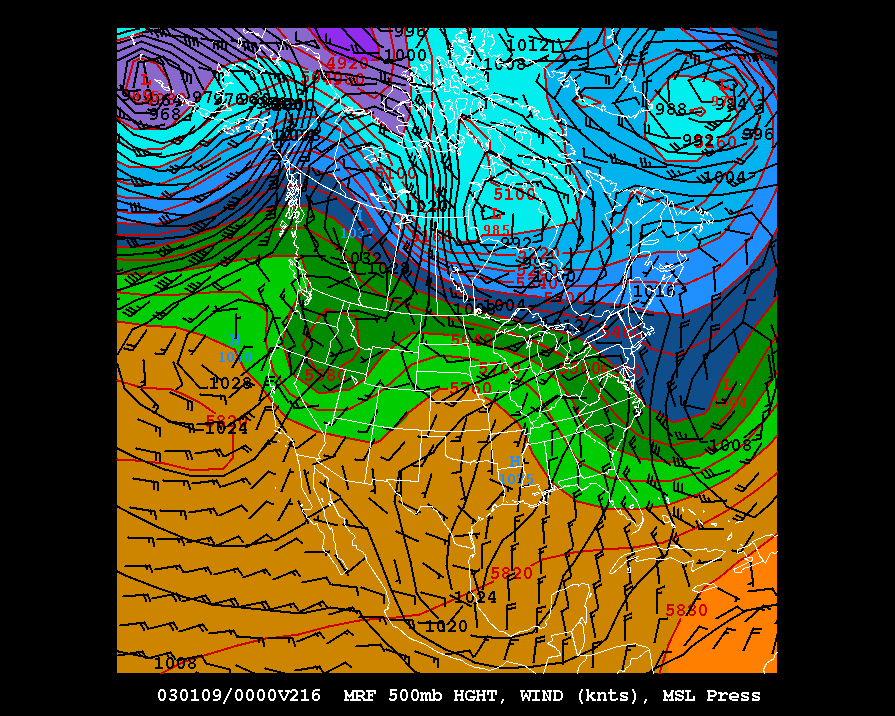
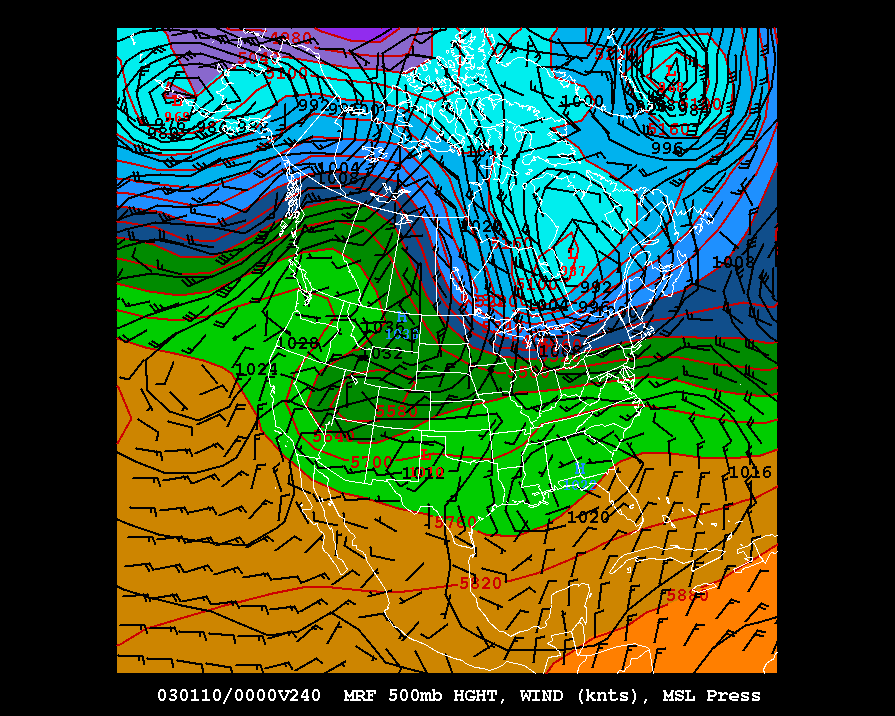
Upper air analysis have many uses. The 300 mb map helps define the
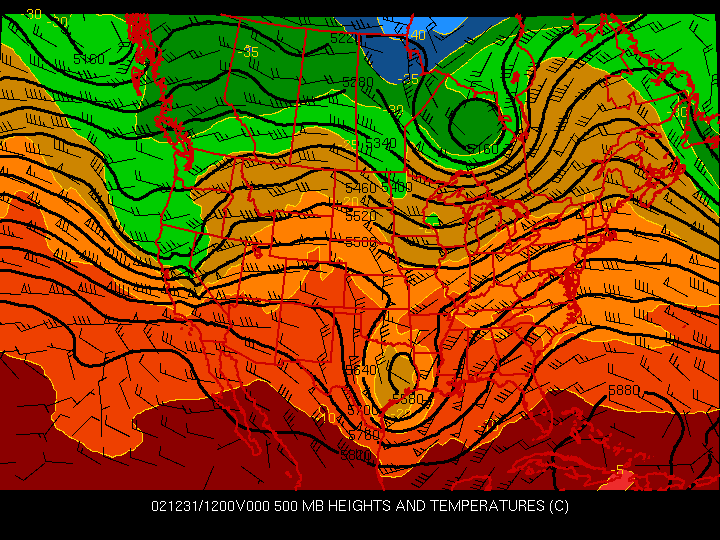
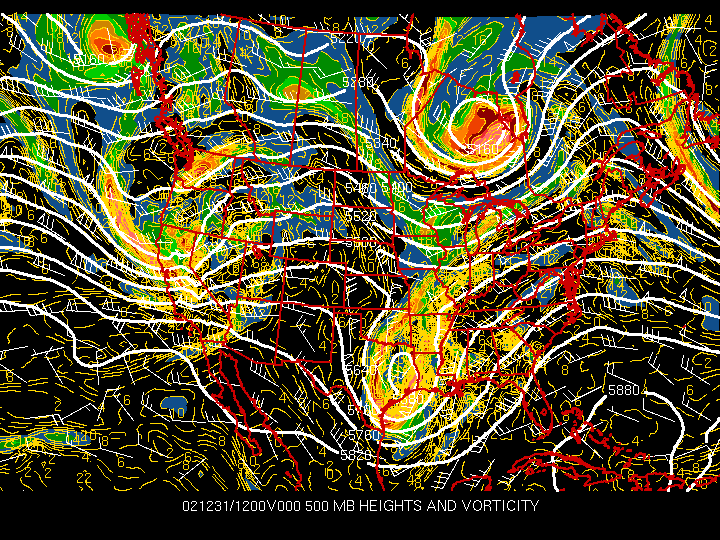
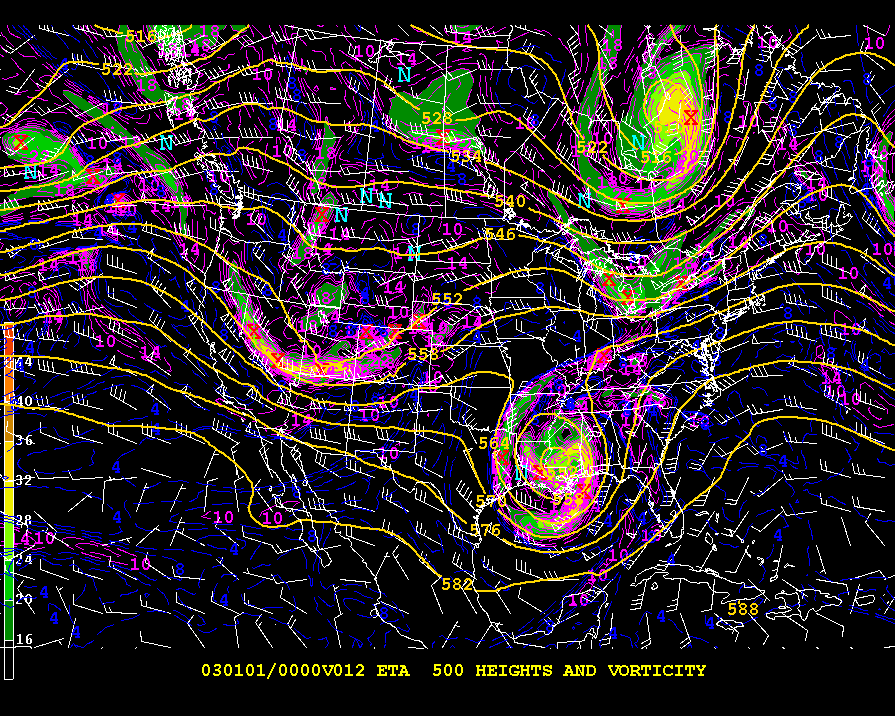
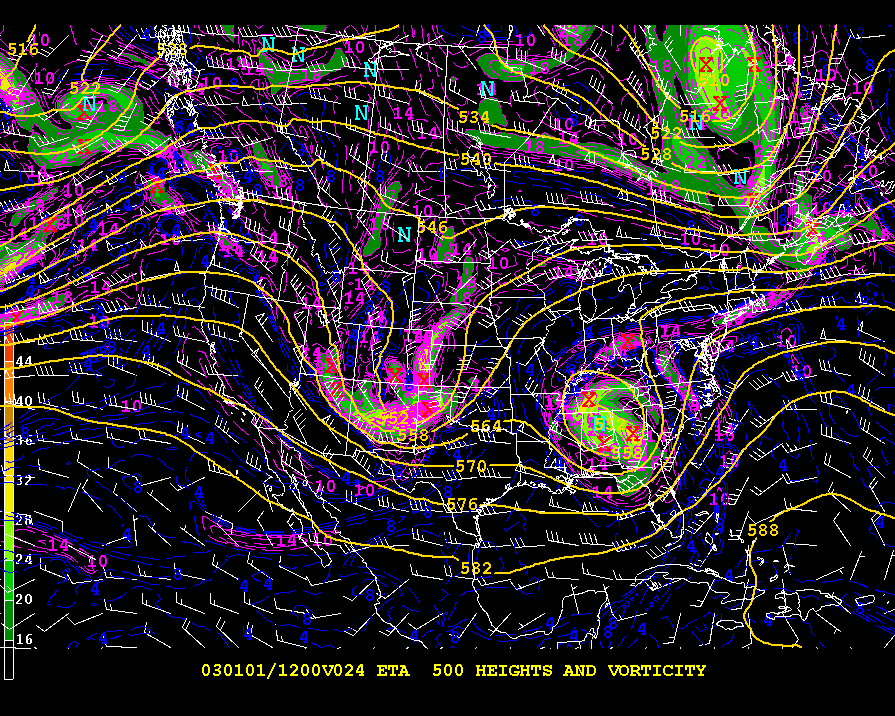
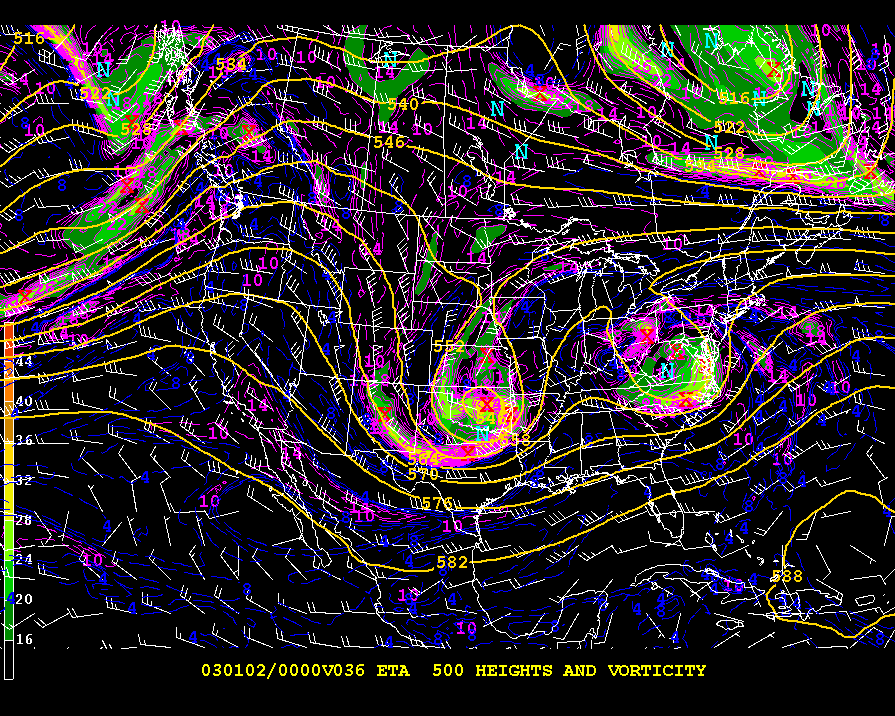
jet stream position. The 500 mb map illustrates the positions of
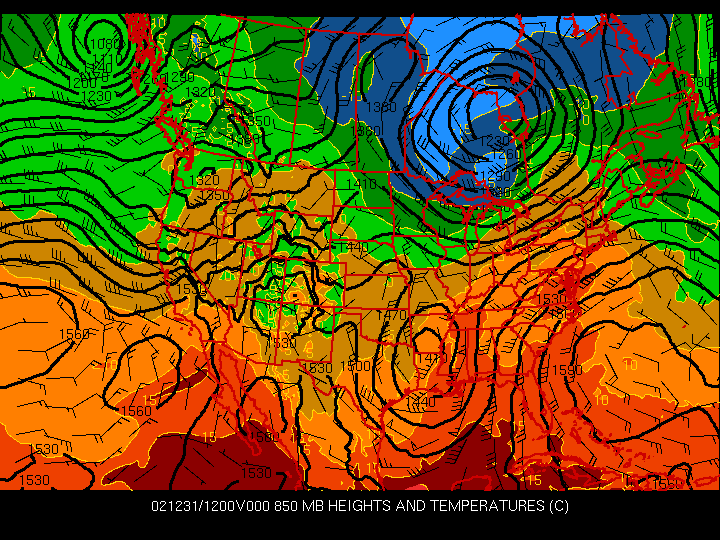
shortwaves, which help produce cloudiness and precipitation. The 850
mb map shows where cold advection and warm advection are occuring.
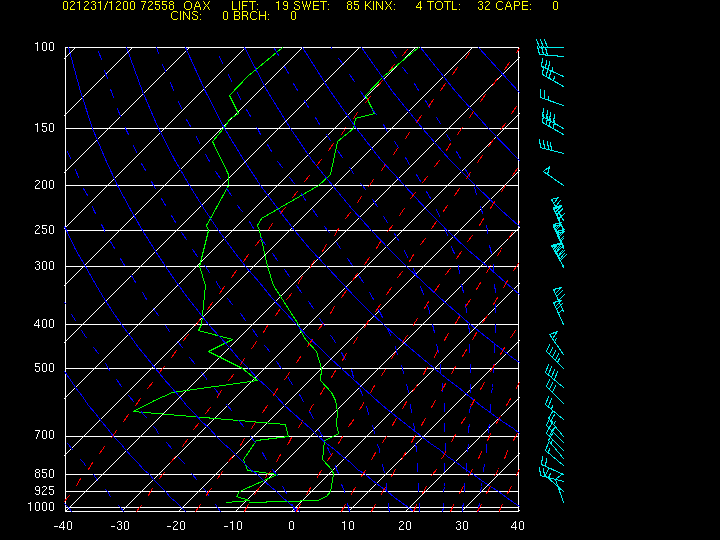
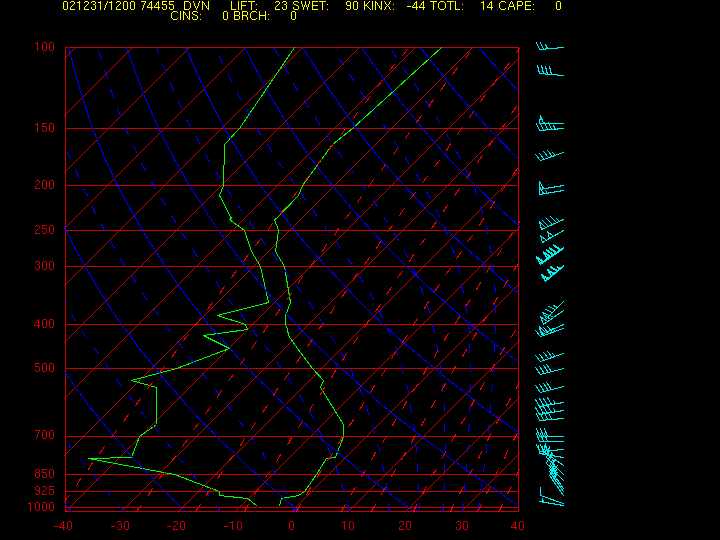
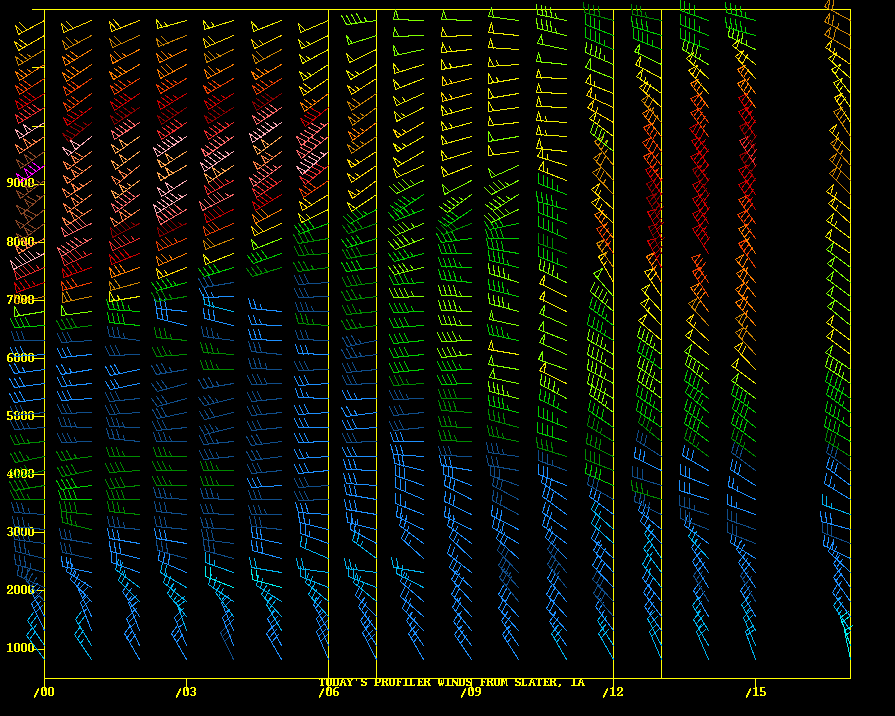
Upper air profiles illustrate a column of the atmosphere at a specific site. |
Revised: 11 Oct 1996
Send comments and suggestions to:
Doug
Yarger (doug@iastate.edu) or Pete
Boysen (pboysen@iastate.edu)
Copyright © 1996,
Iowa State University, All Rights reserved