 Weather Products for Regular Forecast and Help Page
Weather Products for Regular Forecast and Help Page
Weather Products for Regular Forecast and Help Page Surface Productsclick here for location of DesMoines, IA Below, you will find brief explanations as well as a number of links intended to help you when making your daily forecasts.
Surface Products Upper Air Products Model Forecasts Satellite Imagery Radar Imagery Forecasting Check-List
Surface maps display various surface parameters such as pressure, temperature,
and dewpoint temperature. Lows, highs, and fronts are drawn on some maps
to indicate varying surface conditions. These can be used to track areas
of low pressure (usually producing cloudiness and precipitation) and high
pressure (usually clearer weather). Click on the surface map to see
a list of links to current and prognostic surface maps. Click
on the map.

Upper air analysis have many uses. Each map displays different aspects
of the weather situation. The 300 mb map defines the jet stream position.
The 500 mb map illustrates the positions of and troughs and ridges, which
may indicate areas of stormy or fair weather. The 850 mb map can be used
to indicate the presence or absence of moisture available for precipitation.
Click on the map.
Computer models use current weather conditions to project how conditions
will change in the coming hours and days. The model output must be interpreted,
since few normal surface features are drawn on the maps. These are computer
projections and not always correct. These are good to use for a guide but
adaptations must be made. Click on the map.

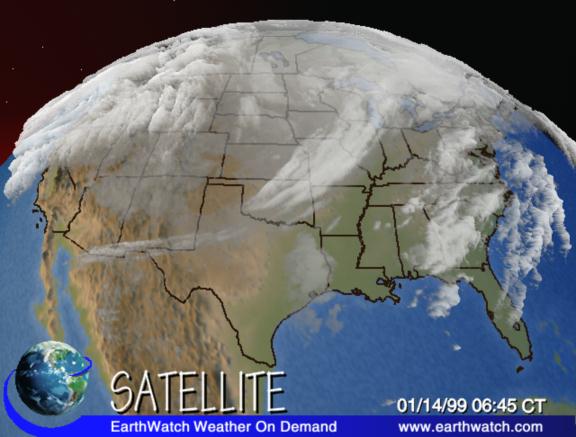
Satellite observations display existing cloud conditions. The visible
picture gives a "camera shot" from space during the day. The infrared measures
temperatures of the cloud tops (useful during the day or night).
Water vapor shows the percentage of water vapor existing through the atmosphere.
Click on the map.
Radar imagery displays areas where precipitation is occurring in liquid
or solid form. This is not a forecast product, but rather a depiction
of current conditions. A radar loop can be used show the progression
of precipitation over several hours. Click on the map.

 We have included a check-list that you may want to print
out and use while making you daily forecasts.
We have included a check-list that you may want to print
out and use while making you daily forecasts.
back to top
Animated GIFs created using GIF Construction Set - http://www.mindworkshop.com/alchemy/gifcon.html
Satellite Images - http://www.earthwatch.com/
Surface Map - http://www.weather.com/
Model Forecast Image - http://wxp.atms.purdue.edu/
Upper Air Map - http://covis.atmos.uiuc.edu/covis/visualizer/
http://cirrus.sprl.umich.edu/wxnet/
http://www.intellicast.com/